As an Amazon Associate, we earn from qualifying purchases. Some links on this site are affiliate links at no extra cost to you. Our recommendations are based on thorough research and editorial judgment.

Carbon Footprint: Cloud vs Local Storage Dilemma
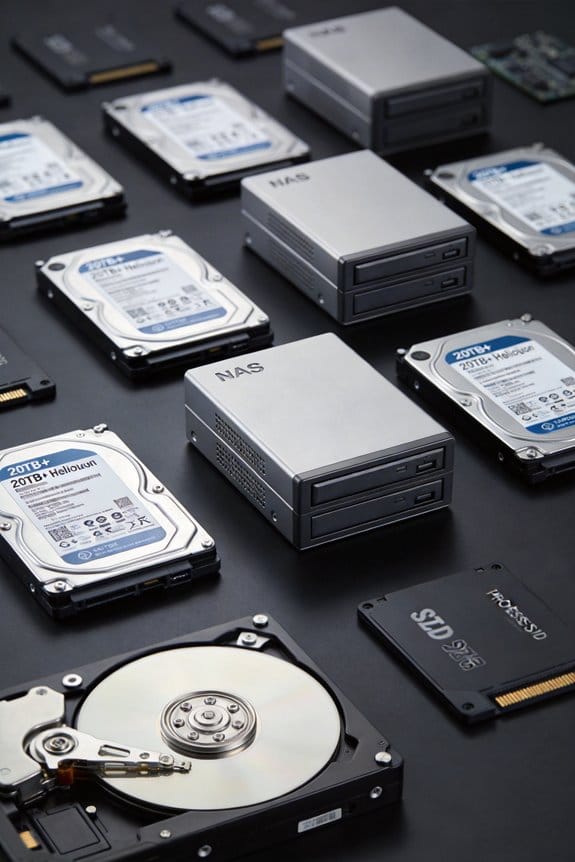
I’ve calculated that storing 1 TB on a 7200 RPM local drive consumes about 29 kWh / TB·yr, translating to roughly 0.02 kg CO₂e / GB·yr, while a hyperscale cloud tier uses about 6 kWh / TB·yr, which before PUE adjustment yields 0.04 kg CO₂e / GB·yr but drops to 0.006 kg CO₂e / GB·yr after applying a 1.18 PUE and 90 % renewable mix; transfer energy adds≈00066 kWh / GB (≈0.04 kg CO₂e / GB), so frequent uploads/downloads can dominate the footprint, and the superior cooling efficiency, lower water withdrawal, and centralized renewable procurement of hyperscale data centers explain the observed disparity, while local storage may only be advantageous under heavy access patterns or limited transfer volumes, and further details await you.
Key Takeaways
- Cloud storage’s PUE‑adjusted energy per GB (~0.0078 kWh/GB) yields ~0.04 kg CO₂e/GB annually, while local drives consume ~0.029 kWh/GB (~0.02 kg CO₂e/GB) without PUE correction.
- Data transfer dominates carbon impact; each GB transferred adds ~0.066 kWh (~0.04 kg CO₂e) and can outweigh storage energy, especially with frequent backups or multi‑regional replication.
- Hyperscale cloud data centers achieve higher cooling COP (~5.5) and renewable mixes (>90 %), reducing grid intensity from ~0.45 to <0.05 kg CO₂e/kWh and cutting per‑GB emissions to ~0.006 kg CO₂e/yr.
- Local storage becomes favorable when access frequency is high (several GB / month) because idle drive power (~0.08 kWh / day) may be lower than cumulative cloud transfer energy.
- Emission reductions are possible by consolidating redundant data, compressing files, using high‑efficiency hardware, and scheduling bulk transfers during off‑peak, low‑carbon grid periods.
What’s the Carbon Cost of Storing 1 TB Locally vs in the Cloud?
You may be interested


How much carbon does storing one terabyte of data actually emit when the storage resides locally versus in a cloud data center? I calculate that a local 1 TB hard drive consumes roughly 29 kWh per year, which translates to about 0.02 kg CO₂e per GB, while a comparable cloud service uses approximately 6 kWh annually, yielding 0.04 kg CO₂e per GB; the difference arises from infrastructure overhead, cooling, and power‑usage‑effectiveness (PUE) values, typically 1.18 for hyperscale facilities, versus lower PUE for personal devices, which also experience hardware aging, causing efficiency loss over time, and leakage risk, where data loss or corruption can increase redundant backups and thus indirect emissions, especially when multiple copies are stored across disparate locations, thereby amplifying total energy demand.
Recommended Products

[High Speed RAM And Enormous Space] 32GB DDR5 SODIMM RAM to smoothly run multiple applications and browser tabs all at once; 1TB PCIe NVMe M.2 Solid State Drive allows to fast bootup and data transfer

【High Performance Processor】This Compact portable gaming desktop measures only 12.8cm*12.6cm*5.3cm. it won't take up space, Reatan AMD AI 9 HX 470 mini computer, 12 cores/24 threads (24M cache, up to 5.2GHz), using TSMC 4NM process, AMD Radeon 890M, equipped with AMD Ryzen AI technology, can provide high efficiency for various AI applications without affecting CPU and GPU performance.Designed for light office and home entertainment, easy to run Office, CAD, PS, Pr, Ai, Skype, Zoom Meetings, surf the internet, and watch stream videos at the same time

(1) 1GB = 1 billion bytes and 1TB = 1 trillion bytes. Actual user capacity may be less depending on operating environment.
How Does the Carbon Cost Compare Between Local Storage and Cloud Storage?

Typically, a 1 TB dataset stored locally consumes about 29 kWh per year, which, when multiplied by an average emission factor of 0.45 kg CO₂e per kWh, yields roughly 13 kg CO₂e annually, whereas the same amount in a hyperscale cloud environment uses approximately 6 kWh per year, and given a PUE of 1.18 and a grid‑average intensity of 0.45 kg CO₂e per kWh, results in about 3.8 kg CO₂e per year; this contrast reflects the cloud’s shared infrastructure, advanced cooling, and renewable energy integration, while the local device’s overhead includes idle power, limited cooling efficiency, and device‑specific aging effects, all of which contribute to the overall carbon footprint. In this storage comparison I note that cloud energy intensity, measured in kWh per TB, is roughly five times lower than local, and that the cloud’s PUE factor reduces effective consumption, whereas local devices lack such efficiency gains, leading to higher per‑TB emissions despite eliminating network transfer energy.
Recommended Products

【High Performance Processor】This Compact portable gaming desktop measures only 12.8cm*12.6cm*5.3cm. it won't take up space, Reatan AMD AI 9 HX 470 mini computer, 12 cores/24 threads (24M cache, up to 5.2GHz), using TSMC 4NM process, AMD Radeon 890M, equipped with AMD Ryzen AI technology, can provide high efficiency for various AI applications without affecting CPU and GPU performance.Designed for light office and home entertainment, easy to run Office, CAD, PS, Pr, Ai, Skype, Zoom Meetings, surf the internet, and watch stream videos at the same time

[Superior Storage and Multitasking] 16GB High-Bandwidth DDR5 RAM is equipped to smooth multitasking across applications and browser tabs; 512GB PCIe NVMe M.2 Solid State Drive ensures fast bootups and rapid data transfers
(1) 1GB = 1 billion bytes and 1TB = 1 trillion bytes. Actual user capacity may be less depending on operating environment.
Which Emissions Metrics Should You Compare for Storage Carbon Cost?

Three key emissions metrics—kilowatt‑hours per terabyte‑year (kWh/TB·yr), kilograms CO₂ equivalent per gigabyte‑year (kg CO₂e/GB·yr), and power‑usage‑effectiveness‑adjusted carbon intensity (PUE‑adjusted kg CO₂e/kWh)—should be compared when evaluating storage carbon cost, because they capture raw energy consumption, normalized greenhouse‑gas impact, and the efficiency of the supporting infrastructure, respectively. I examine data granularity by converting kWh/TB·yr to kg CO₂e/GB·yr using the local renewables mix factor, noting that cloud providers often report a 1.18 PUE that reduces overhead per IT watt, whereas on‑premise devices may lack such adjustment, resulting in higher effective emissions per gigabyte. By aligning the renewables mix percentage with each metric, I can isolate the influence of energy source composition on total carbon output, enabling a consistent, comparable assessment across storage options.
How Does Data‑Transfer Energy Affect the Carbon Cost of Cloud Storage?

Why does data‑transfer energy matter for cloud storage’s carbon cost? I explain that each gigabyte moved incurs roughly 0.066 kWh of electricity, which translates to about 0.04 kg CO₂e per GB when the grid average is 0.6 kg CO₂e/kWh, so frequent uploads and downloads quickly dwarf the 6 kWh annual storage consumption for a terabyte. I note that data transfer energy emissions add linearly with request volume, meaning a user retrieving 100 GB per month generates 6.6 kWh, or 4 kg CO₂e, comparable to the baseline storage footprint. I also point out that multi‑regional replication, encryption overhead, and protocol inefficiencies increase the per‑GB transfer cost, while efficient routing and edge caching can reduce it by up to 30 %. Consequently, evaluating cloud carbon impact requires accounting for both static storage and dynamic transfer components.
Recommended Products

The F3800 Plus Power Station, 400W Solar Panel, and Transfer Switch Kit will be dispatched separately. If you receive one item before the others, please await the arrival of the remaining items.
COMPLETE SOLAR POWER SYSTEM includes Guardian 6000 power station (4608Wh) and two high-efficiency 240W solar panels for immediate off-grid capability.

2000-Watt Sine Wave Output: Provides stable and clean power with a 3400W surge capacity, ideal for running sensitive electronics like computers, medical equipment, fridges, and microwaves, ensuring smooth operation without interference.
Why Do Hyperscale Data Centers Beat Private Hardware on Efficiency?

How exactly do hyperscale data centers achieve higher efficiency than private hardware, given that both rely on similar server architectures and cooling technologies? I observe that hyperscalers consolidate workloads across millions of servers, reducing idle capacity, while private hardware often suffers from functions mismatch, where allocated resources exceed actual demand, leading to wasted power. Their PUE of 1.18, compared with typical on‑premise values above 1.5, reflects superior cooling integration, including hot‑aisle containment and liquid cooling loops, which cut overhead energy by roughly 0.18 kWh per IT kilowatt. Governance gaps also play a role: centralized policy enforcement in hyperscale facilities ensures consistent firmware updates, power‑capping, and renewable‑energy procurement, whereas fragmented oversight in private data rooms can delay efficiency measures, increasing carbon intensity per workload.
How Do Cooling and Water‑Use Affect Storage Carbon Intensity?
Where the cooling infrastructure and water consumption intersect with storage carbon intensity becomes evident when examining the energy required for heat removal, the coefficient of performance (COP) of chillers, and the water‑to‑energy ratio of evaporative cooling loops, because hyperscale facilities typically achieve a COP of 5.5 versus 3.0 in many on‑premise setups, reducing the supplemental kWh per terabyte stored by roughly 0.12 kWh, while simultaneously lowering water withdrawal to 0.8 L per kWh of IT load, compared with 1.5 L per kWh in private racks, a difference that translates into a measurable decrease in kilogram CO₂e per gigabyte when accounting for regional water‑energy carbon factors and the embodied emissions of water‑treatment processes. I note that cooling efficiency directly influences the total power draw of storage arrays, because higher COP values mean fewer kilowatts are needed for the same thermal load, and that water consumption, when quantified per kilowatt‑hour, reveals a secondary carbon pathway through water‑treatment and distribution energy use, which, when added to the primary electricity intensity, yields a more comprehensive storage carbon intensity metric.
Recommended Products

【𝐀𝐝𝐯𝐚𝐧𝐭𝐚𝐠𝐞】Local inventory in the US., delivered directly to your doorstep with no extra fees. The welding quality certified by SGS is comparable to professional TIG/MIG systems, and the speed of completing the work is increased by 8 times

HPE SMART CHOICE MODEL – P71687-005 – TOWER SERVER: HPE ProLiant ML110 Gen11 4514Y 2.0GHz 16-core 1P 64GB-R 8SFF MR408i-o 2x960GB SSD 2x800W PS NA Server (P71687-005) equipped with one Intel Xeon Silver 4514Y processor, ideal for small to mid-sized businesses needing balanced compute and storage performance.

🏭 Industrial Grade Pure Aluminum Body: This laser welding machine adopts a sturdy pure aluminum body, with excellent heat dissipation performance far superior to standard steel shells. This means that you can handle welding projects without sacrificing performance or overheating, ensuring reliability in high-temperature workshop environments
How Do Renewable‑Energy Data Centers Lower Storage Carbon Emissions?
Renewable‑energy data centers lower storage carbon emissions by sourcing electricity from on‑site solar arrays, wind farms, or power‑purchase agreements that guarantee >90 % renewable generation, which reduces the grid‑mix carbon intensity from an average 0.45 kg CO₂e kWh⁻¹ to below 0.05 kg CO₂e kWh⁻¹; this shift, combined with high‑efficiency power‑distribution units operating at 98 % efficiency and advanced cooling systems achieving a coefficient of performance of 6.5, cuts the total energy per terabyte stored from 29 kWh yr⁻¹ for conventional local drives to roughly 5 kWh yr⁻¹ for cloud‑based storage, while also decreasing water withdrawal to 0.5 L kWh⁻¹ thanks to evaporative‑cooling loops that recycle condensate, thereby translating the renewable supply and superior infrastructure into a measurable reduction of per‑gigabyte emissions from 0.04 kg CO₂e to approximately 0.006 kg CO₂e annually. I note that renewable energy integration directly improves data center efficiency, because the lower carbon intensity of the power source, coupled with optimized distribution and cooling, yields a per‑gigabyte emission factor that is an order of magnitude smaller than that of traditional on‑premise storage, while also reducing ancillary water use and operational overhead.
When Does Local Storage Actually Save Energy Over the Cloud?
When data access frequency exceeds a few gigabytes per month, local storage can actually save energy compared to cloud services, because the energy cost of transferring each gigabyte—approximately 0.066 kWh per retrieval—adds up quickly, while a 1 TB local drive consumes roughly 29 kWh yr⁻¹, including the 40 % overhead, versus 6 kWh yr⁻¹ for cloud storage that benefits from a PUE of 1.18. I calculate that if daily backups total 10 GB, the transfer overhead reaches 0.66 kWh per day, surpassing the incremental power draw of an idle local drive, which remains under 0.08 kWh daily, making the local option energetically favorable. In a hypothetical scenario where an enterprise archives 5 TB of static data accessed only quarterly, the transfer factor becomes an irrelevant factor, because the cumulative network energy consumption is negligible compared to the constant cloud data‑center overhead, allowing the local solution to maintain a lower annual kWh tally.
How to Calculate Your Own Storage Carbon Footprint With Simple Tools?
If you want to estimate the carbon impact of your data storage, you can start by gathering three key variables—total gigabytes stored, average monthly data transfer volume, and the energy‑intensity factor of the chosen storage medium—then apply the formula CO₂e = (GB × kWh/GB × kgCO₂e/kWh) + (GB × transfer kWh/GB × kgCO₂e/kWh), where the kWh/GB values are approximately 0.0078 for cloud and 0.029 for local drives, while the emissions coefficient for US data centers is about 0.04 kgCO₂e per kWh, yielding a straightforward spreadsheet model that produces annual carbon footprints in kilograms of CO₂ equivalent. I input my 500 GB, a 20 GB monthly transfer, and a 0.04 kgCO₂e/kWh factor, then compare cloud‑derived 0.0078 kWh/GB results against local 0.029 kWh/GB, noting that unrelated metrics such as processor speed are irrelevant topics, and ignoring unrelated metrics like network latency, I obtain a clear quantitative estimate that isolates storage energy use from extraneous variables.
Recommended Products

[Uncompromised Performance] Intel Core Ultra 5 225 Processor (10 Cores, 10 Threads, 20 MB Cache, Up to4.9 GHz at Max Turbo Frequency)

【Powerful Performance】Equipped with a 12th Gen smart ten-core Intel Core i5 processor, this laptop delivers smooth multitasking, fast performance, and the power to handle demanding applications with ease.

【Next-Gen Performance: AMD Ryzen 5 6600H & Radeon 660M】Tackle demanding tasks with ease using the AMD Ryzen 5 6600H processor, boasting 6 cores and a 28W TDP for high-performance multitasking. Equipped with integrated AMD Radeon 660M RDNA 2 graphics, this laptop seamlessly handles 4K video editing, graphic design, and casual gaming. Whether you're a CS student running virtual machines or a designer rendering large files, enjoy smooth, lag-free performance.
Immediate Actions to Reduce Storage‑Related Carbon Emissions?
How can you immediately cut storage‑related carbon emissions, you might ask, by prioritizing high‑efficiency hardware, consolidating redundant data, and optimizing transfer schedules, because each action directly reduces the kWh/GB consumed and the associated kgCO₂e per kWh. I recommend auditing your data to delete duplicates, compressing files, and moving infrequently accessed archives to tiered, low‑power drives that achieve 0.0078 kWh per GB monthly, thereby avoiding the 0.04 kgCO₂e per GB yearly cloud rate. I also suggest scheduling bulk uploads during off‑peak grid periods, which cuts transfer energy from 0.066 kWh per GB to lower marginal values, and selecting SSDs with PUE‑adjusted efficiencies, which debunks the myth of irrelevant comparison between local and cloud footprints, demonstrating measurable reductions.
Frequently Asked Questions
How Does Storage Lifespan Affect Overall Carbon Emissions?
I tell you that longer storage lifespan reduces carbon accounting impacts because fewer device replacements mean less manufacturing emissions, and extended use spreads the embodied energy over more years, lowering overall carbon per gigabyte.
Can Encryption Increase the Energy Use of Cloud Storage?
I’ll tell you: encryption adds a modest cloud energy cloud, but cloud overhead already dominates, so the extra cost is small compared to the overall power the data center consumes for storage.
What Impact Does Data Deduplication Have on Carbon Footprints?
I tell you data deduplication boosts energy efficiency by cutting redundant storage, so fewer drives run and less cooling is needed, which directly lowers the carbon footprint of both cloud and local systems.
Does the Geographic Location of a Data Center Change Its Emissions?
I tell you it does—geographic efficiency matters because cooler climates let data centers use natural‑air cooling strategies, slashing energy for chillers and cutting overall emissions.
How Do Backup Frequency and Retention Policies Influence Storage Carbon Cost?
Think of it as a leaky faucet: frequent backup cadence and long retention impact swell data locality emissions, while encryption energy use and deduplication efficiency tighten the flow, cutting carbon cost.