As an Amazon Associate, we earn from qualifying purchases. Some links on this site are affiliate links at no extra cost to you. Our recommendations are based on thorough research and editorial judgment.

Power Density: Rack-Scale Storage Efficiency Metrics
I define rack‑scale storage power density as total kilowatts consumed per cabinet, which directly drives cooling load, operational cost, and equipment placement; standard racks (4–12 kW) use conventional air cooling, high‑density racks (12–20 kW) require advanced air or supplemental liquid cooling, and ultra‑high‑density racks (30–100 kW) rely on direct‑to‑chip liquid loops, while metrics such as kW/TB (e.g., 0.013 kW/TB for a 20 kW rack holding 1.5 PB) and kW/IOPS enable quantitative comparisons across categories, and PUE‑adjusted power‑cost models show liquid cooling can cut total energy consumption by up to 30 % versus air cooling for racks exceeding 20 kW, revealing deeper insights if you explore further.
Key Takeaways
- Rack‑scale power density is measured in kilowatts per cabinet, linking energy use to cooling, cost, and placement decisions.
- Efficiency metrics such as kW/TB, kW/IOPS, and kW per square foot quantify storage capacity, performance, and space utilization.
- Higher density racks (≥20 kW) benefit from liquid cooling, reducing PUE to ~1.10–1.20 and cutting total power by up to 30 % versus air cooling.
- Annual energy cost = rack kW × PUE × 8,760 h × electricity rate; PUE variations from 1.1 to 1.58 can shift costs 25‑30 %.
- Optimizing for minimal kW/TB (e.g., ~0.013 kW/TB for a 20 kW rack) directly lowers energy cost per terabyte, crucial for AI‑heavy workloads.
Rack‑Scale Storage Power Density: Definition and Why It Matters
You may be interested


One or two kilowatts per rack defines the baseline power density, yet the term “rack‑scale storage power density” specifically quantifies the total kilowatts consumed by all storage devices within a single rack, measured in kW per cabinet, and it matters because it directly links energy consumption to cooling requirements, operational cost, and equipment placement decisions. I explain that power density, expressed in kW per cabinet, determines rack efficiency by dictating how much heat must be removed, which in turn drives the design of cooling infrastructure and influences the total cost of ownership. For example, a 20 kW high‑density rack consumes three times the energy of a standard 7 kW rack, requiring liquid‑cooling loops, while an AI‑capable 60 kW rack demands specialized power distribution units and higher PUE targets to maintain efficiency. Consequently, precise measurement of power density enables data‑center planners to balance performance, thermal limits, and budget constraints.
Rack Density Categories: Power Ranges, Footprint, and Typical Use Cases

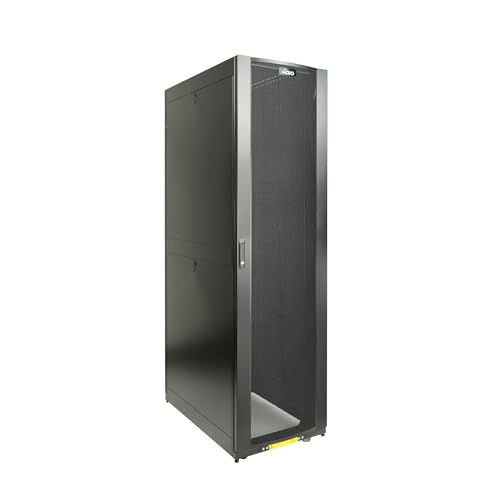
Measuring power density at the rack level naturally leads to categorizing racks by their wattage, footprint, and typical workloads, because each category dictates distinct cooling strategies, power distribution requirements, and space allocations. I explain that standard racks, consuming 4‑12 kW, occupy about 6.5 sq ft, support general‑purpose workloads, and rely on conventional air‑flow cooling, while high‑density racks, ranging 12‑20 kW, expand footprint to roughly 53.8‑75.3 sq ft, host compute‑intensive applications, and require advanced air‑cooling or supplemental liquid cooling for cooling optimization. Very high‑density liquid‑cooled racks exceed 20 kW, demand 64.6‑96.9 sq ft, accommodate GPU‑heavy AI workloads, and integrate direct‑to‑chip cooling loops to maintain thermal limits. Ultra‑high‑density AI‑capable racks, often 30‑100 kW, consume up to 132‑240 kW in emerging designs, necessitate dense manifold networks, and prioritize cooling optimization to sustain performance.
Recommended Products

Super-Rigid 39.75"-tall five-shelf audio component rack - supports up to 75 lbs. (34 kg) per shelf or 350 lbs. (159 kg) total per rack

EASY TO USE: Just step on the foot pump to activate a 220ml continuous water flow per press. The 7+ gal tank delivers over 100 washes per fill—perfect for camping, events, or outdoor work.

Measures 26" L x 20" W x 38" H with a 10-tier design. Holds up to 10 full-size sheet pans or 20 half-size sheet pans, with shelves spaced 3 inches apart.
Power‑Cost Modeling for Rack‑Scale Storage Using PUE and Electricity Rates

How does a rack’s power‑cost model incorporate PUE and electricity rates, given that the total energy consumption equals the rack’s baseline kW multiplied by the PUE factor and then by the annual operating hours? I calculate the baseline consumption by multiplying the rack’s rated kilowatts—say 20 kW for a high‑density unit—by the PUE, often 1.2 for efficient facilities, then by 8,760 hours, producing 174,720 kWh annually; I then apply the local electricity rate, for example $0.12/kWh, to derive a cost of $20,966. I ignore energy efficiency myths that suggest linear savings, because power distribution losses, cooling overhead, and auxiliary loads compound non‑linearly, especially when PUE varies from 1.1 to 1.58, which can shift costs by 25 % to 30 %, and I always verify that the total cost reflects both IT and facility power consumption.
Recommended Products

Full-Scale Professional Network-Attached Storage – Business storage solution with hard drives included and optimized to store, share, and back up data for environments of any size.

Scale up to 24 drive bays with one Synology RX1223RP Expansion Unit

Bundle Includes: The Bundle includes the Squat Rack with pull up bar, plate and bar storage, and the Weight Lifting Platform to give you everything you need in your light-commercial gym,home gym or garage gym
Cooling Options That Cut Rack‑Scale Storage Power Costs (Air vs. Liquid >20 kW)

The power‑cost model I described earlier assumes a static PUE, yet when a rack exceeds 20 kW the cooling architecture—air versus liquid—directly influences that factor, because air‑cooled designs typically operate with PUE values between 1.45 and 1.58, whereas liquid‑cooled systems can maintain PUE near 1.10‑1.20 by removing heat at the rack level, reducing distribution losses and auxiliary fan power, which in turn lowers the annual kWh calculation and the resulting electricity expense; consequently, evaluating cooling options for high‑density storage requires quantifying the incremental energy draw of supplemental fans, chillers, and pumps, comparing the 20 kW‑to‑30 kW range where liquid manifolds achieve up to 30% lower total power consumption, and factoring the associated capital and maintenance costs to determine the net cost‑of‑ownership advantage over traditional air‑cooled configurations. My cooling strategy is thus focused on power optimization through liquid loops, because pump efficiency, coolant flow rates, and rack‑level heat exchangers collectively reduce auxiliary loads, while air‑based systems demand higher fan speeds, larger CRAC units, and greater ductwork, all of which increase both operational electricity and maintenance overhead.
Recommended Products
DUAL SYSTEM CAPABLE: Designed to accommodate (2) completely separate systems/motherboards/power supplies/VGA cards/ main component in a Back-to-Back configuration

【Native Wonder Wheel Control】 The BMW Wonder Wheel allows you to effortlessly control the audio display on the W502BS Pro motorcycle, such as TPMS, fuel levels, engine RPM, mileage, and more. The TPMS requires that your BMW motorcycle is equipped with a pre-installed TPMS system. Without it, the TPMS will not be operational. And, please ensure that you are using an original BMW bracket, as third-party mounts are not compatible with the BMW Wonder Wheel Control.

Extra Storage - Numerous storage options are provided by the 3 full-width inside glass shelves. leveling legs that may be adjusted for easy positioning, It is easy to obtain soda and juice cans thanks to the door's dispenser-can storage. two full-width door rack provide flexible additional storage for taller bottles of upto 2 liter.
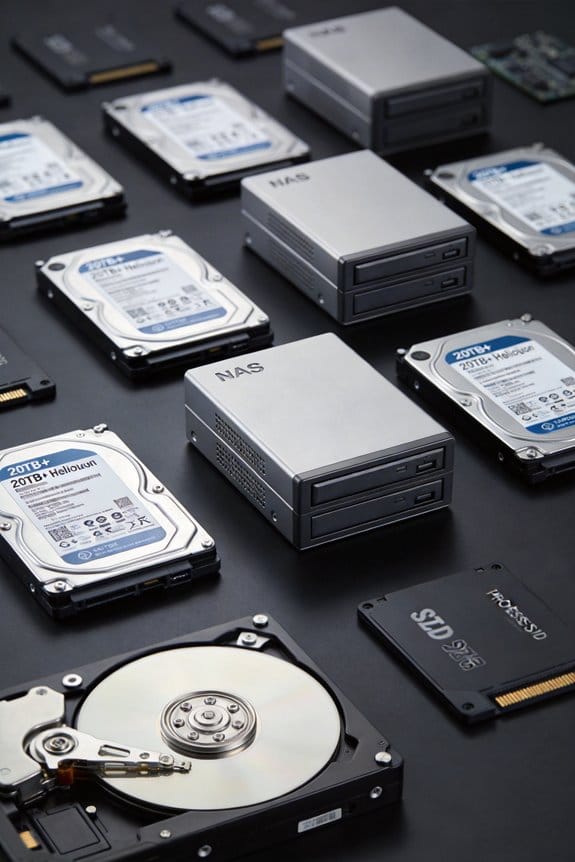
Storage Efficiency Metrics: kW/TB, kW/IOPS, and Space‑Adjusted Measures

Why focus on kW per terabyte, kW per IOPS, and space‑adjusted ratios when evaluating rack‑scale storage efficiency? I measure storage efficiency by dividing total power draw, expressed in kilowatts, by usable capacity, typically terabytes, which yields a kW/TB figure that directly reflects power density across a cabinet; similarly, kW/IOPS quantifies energy per input/output operation, enabling comparison of performance‑oriented workloads, while space‑adjusted metrics combine kW/TB with rack footprint, allowing a nuanced view of density versus physical real‑estate consumption. For example, a 20 kW high‑density rack delivering 1.5 PB of usable storage presents roughly 0.013 kW/TB, whereas a 60 kW AI‑optimized rack with 2 PB yields 0.030 kW/TB, indicating higher power density; when adjusted for a 70 sq ft footprint, the former achieves 0.19 kW/TB per square foot, the latter 0.43 kW/TB per square foot, illustrating the trade‑off between capacity, performance, and space.
Recommended Products

【Reliable Quality & Grade A Cells】: We have a professional lithium battery research and production factory, using A-grade battery cells to produce our batteries. Each battery leaving the factory has strict inspection standards, and most importantly, we have this absolute cost advantage while ensuring quality. We have a one month no reason return period. What are you still worried about? Give NewtiPower a try now!
Large 5000VA/4000W output capacity with full-time sine wave output offers guaranteed compatibility with all equipment types

Revolutionary Comfort: Say goodbye to riding discomfort. The unique Butterfly Handlebar encourages an relaxed, upright posture, allowing you to change hand positions to prevent numbness and fatigue. Paired with the height-adjustable seat and supportive backrest, you can ride for hours in complete comfort.
Optimized Rack Layout for Rack‑Scale Storage: White Space, Grey Space, and Aisle Widths
Where does the optimal balance between white space, grey space, and aisle width reside in a high‑density rack, given that standard racks allocate 35–63 sq ft of white space, 10.8–19.4 sq ft of grey space, and 8.1–14.5 sq ft of aisles per rack, while ultra‑high‑density configurations push total footprint to 64.6–96.9 sq ft to accommodate 30–85 kW per cabinet and maintain PUE targets of 1.1–1.3; I calculate that allocating 45 sq ft white space, 12 sq ft grey space, and 10 sq ft aisles yields a total of 67 sq ft, which supports a 20 kW high‑density rack delivering 1.5 PB of usable storage, resulting in 0.013 kW/TB and 0.19 kW/TB per square foot, whereas increasing aisle width to 14 sq ft for a 60 kW AI‑optimized rack delivering 2 PB raises total footprint to 71 sq ft, producing 0.030 kW/TB and 0.43 kW/TB per square foot, demonstrating the trade‑off between cooling clearance, power density, and space‑adjusted efficiency. I also note that tighter aisles improve data center aesthetics but can hinder maintenance scheduling, while modest grey space allocation supports cable management without sacrificing thermal performance, and the chosen white space proportion influences both visual uniformity and future expandability.
Recommended Products

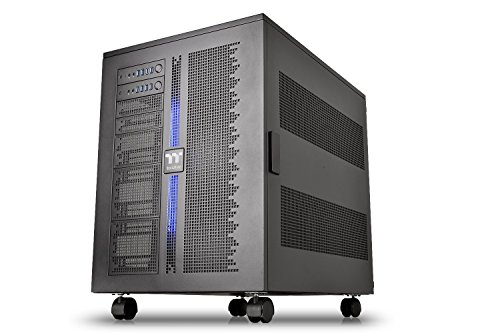
BUILT-TO-LAST ENGINEERING This 48U rack is designed for rapid deployment even in high density environments with load capacities of 3 000 pounds static and 2 500 pounds dynamic

Meets all enclosure requirements towards PCI DSS (Payment Card Industry Data Security Standard) compliance
Tecmojo network server cabinet is designed to provide a high quality and secure installation solution for storage of all EIA-310-E compliant 19-inch mounting width networking equipment such as severs, computer, routers, patch panels, PDUs and more.
Future‑Proofing Rack‑Scale Storage Power Density: Trends & Roadmaps 2026‑2030
High‑density rack layouts that balance white, grey, and aisle space have already shown that a 20 kW configuration can achieve 1.5 PB storage at 0.013 kW/TB, yet scaling to 60 kW AI‑optimized racks raises power per terabyte to 0.030 kW/TB and demands a 71 sq ft footprint, so future‑proof designs must incorporate liquid‑cooling manifolds, modular power distribution units, and scalable cable‑management trays to support projected 30–85 kW per cabinet while keeping PUE between 1.1 and 1.3; by 2028, industry surveys predict average rack densities of 27 kW, with NVIDIA’s next‑gen GPU servers targeting 132–240 kW, implying that data‑center operators will need to allocate up to 96.9 sq ft per rack, integrate high‑efficiency heat exchangers, and adopt dynamic load‑balancing software that can adjust voltage and frequency on the fly, thereby maintaining thermal headroom and minimizing energy cost per terabyte as AI workloads dominate. I also note that irrelevant topic and off topic analysis must be excluded from design documentation, ensuring all metrics remain directly tied to power‑density objectives.
Frequently Asked Questions
How Does Rack Power Density Affect SSD Endurance?
I tell you rack higher power density speeds up SSD wear because thermal management gets tougher, raising temperatures that accelerate cell degradation, so better rack efficiency and cooling are essential to preserve endurance.
What Is the Optimal PUE for Liquid‑Cooled AI Racks?
I’d say the optimal PUE for liquid‑cooled AI racks is practically 1.0—so close it feels like a fantasy. This optimal cooling, energy modeling, cost forecasting, rack deployment efficiency, computational density, and thermal management all converge at that near‑perfect efficiency.
Can kW/Tb Metrics Predict Future Scaling Costs?
I think you can use kW/TB metrics to forecast scalability costs, especially when you factor in power density and endurance metrics; liquid cooling will keep those projections realistic.
How Many IOPS per kW Are Realistic for 30 kW Racks?
I’d say roughly 150‑200 k iops per kW is realistic for a 30 kW rack, assuming modern NVMe drives and efficient cooling. That translates to about 4.5‑6 M iops per rack at that density.
What Aisle Width Balances Airflow and Space for 40 kW Racks?
I’ve seen a 40 kW rack fit snugly with a 4‑foot aisle, letting Aisle airflow stay strong while Rack spacing feels comfortable; that balance boosts Power density and improves Cooling efficiency across the hall.