As an Amazon Associate, we earn from qualifying purchases. Some links on this site are affiliate links at no extra cost to you. Our recommendations are based on thorough research and editorial judgment.

TBW vs Real-World SSD Endurance Testing
I define TBW as total bytes written, calculated by multiplying SSD capacity by rated P/E cycles and dividing by the write‑amplification factor, then I note that a 1 TB drive rated for 1,500 P/E cycles with a typical WAF of 1.2 yields roughly 1,250 TBW, matching many three‑to‑five‑year warranties, and I explain that temperature spikes above 70 °C, sudden power loss, firmware wear‑leveling defects, and increased WAF can dramatically reduce real‑world endurance, while JEDEC and ATP tests impose 55 °C or 70 °C stress, 1‑year data retention, and WAF limits under 1.5, and I compare TBW to DWPD by showing that a 2 TB enterprise SSD rated for 3 DWPD over five years implies about 10,950 TBW, whereas a consumer 1 TB drive with 600 TBW corresponds to only 0.33 DWPD, and I conclude that selecting an SSD with appropriate TBW, DWPD, thermal specs, over‑provisioning, and NAND type will align endurance with write‑intensity needs, offering further insight if you explore the details.
Key Takeaways
- Real‑world TBW often falls short of nominal specs due to temperature spikes, power loss, and firmware wear‑leveling inefficiencies.
- Manufacturers calculate TBW as capacity × rated P/E cycles ÷ WAF; a higher actual WAF (e.g., >2.0) dramatically reduces usable endurance.
- JEDEC and ATP endurance tests enforce 55 °C–70 °C limits, power‑loss simulations, and WAF caps (<1.5) to approximate worst‑case wear.
- DWPD translates TBW into daily write allowances; enterprise SSDs may sustain 3 DWPD, while consumer drives typically allow <0.5 DWPD.
- Selecting SSDs for write‑intensive workloads requires matching TBW/DWPD to expected daily writes, checking thermal throttling specs, and verifying robust wear‑leveling firmware.
Define TBW and Explain How It’s Calculated
You may be interested


A TBW, or total bytes written, quantifies the cumulative amount of data an SSD can reliably store before its NAND cells begin to fail, and it is calculated by multiplying the drive’s capacity by the rated program‑erase (P/E) cycles of its NAND, then dividing the product by the write‑amplification factor (WAF) that reflects the controller’s overhead. I explain that this metric directly links NAND endurance to warranty metrics, because manufacturers embed TBW limits within warranty terms, allowing users to compare drive reliability across capacities such as 500 GB, 1 TB, or 2 TB, each with distinct P/E cycles ranging from 300 to 3 000. The resulting TBW figure, expressed in terabytes, predicts total writes before failure; for example, a 1 TB SSD rated at 1 500 P/E cycles and a WAF of 1.2 yields roughly 1 250 TBW, which aligns with typical consumer warranty periods of three to five years.
Identify Real‑World Conditions That Skew TBW

Because temperature fluctuations, power instability, and firmware anomalies each introduce wear mechanisms that are not reflected in the nominal TBW calculation, real‑world conditions can cause an SSD to reach its failure point well before the advertised total bytes written threshold. I notice that temperature spikes above 70 °C accelerate NAND degradation by increasing charge leakage, which reduces program‑erase cycle endurance by up to 30 % compared with the 25 °C baseline used in TBW models, while sudden power loss events trigger incomplete program operations, causing latent block failures that compound with normal wear. Firmware bugs, such as incorrect wear‑leveling algorithms or faulty garbage‑collection triggers, can concentrate writes on a subset of blocks, effectively inflating write amplification from the expected 1.2 to values exceeding 2.0, thereby exhausting the drive’s endurance budget far earlier than the advertised TBW figure predicts.
Recommended Products
Storage optimized for caching in NAS systems to rapidly access your most frequently used files.

High-Speed Performance: The SSD370 offers sequential read speeds of up to 570MB/s and write speeds up to 470MB/s, depending on the capacity, ensuring quick data access and transfer.

Welcome to the World of PCIe 4.0: Designed to deliver an enhanced PC experience, the EXCERIA PLUS G3 SSD series is compatible with PCIe 4.0 and delivers exceptional transfer speeds of up to 5,000 MB/s for sequential reads and 3,900 MB/s for sequential writes. Whether you are gaming or video editing, this new series will provide the performance needed.
Review Standard Endurance Tests (Jedec, ATP, Etc.)

When I examine the standard endurance tests, I start with JEDEC JESD‑20‑C, which defines a 100 % program/erase cycle test at 55 °C, measures data retention after 1 year, and requires a minimum of 3 000 P/E cycles for consumer‑grade TLC, while enterprise‑grade SLC must sustain 100 000 cycles; the test also records write amplification, typically 1.2, and monitors error‑correction‑code (ECC) failure rates, which must stay below 10⁻⁶ per bit. I then run the ATP test, which expands the temperature chamber range to 70 °C, adds random‑write stress, and logs controller firmware responses, capturing wear‑leveling efficiency and error‑rate trends across 10 000 cycles. Both standards demand periodic power‑loss simulations, verify that retained data meets the 1‑year benchmark, and require that measured WAF remains under 1.5, ensuring comparable baseline data for any NAND type.
Recommended Products

Robust system responsiveness and exceptional I/O performance

Boost productivity or design creatives effortlessly by upgrading to PCIe Gen 4.0 SSDs with up to 4,150 MB/s (2) read speeds (1TB and 2TB (1) models)

Sequential read speeds of up to 545MB/s and sequential write speeds of up to 525MB/s.
Compare TBW vs. DWPD for Different Workloads
If you compare TBW and DWPD across workloads, you’ll see that TBW quantifies total bytes written over a drive’s lifetime, while DWPD expresses the number of full‑drive writes per day that a warranty permits; for a 2 TB enterprise SSD rated at 3 DWPD over a five‑year warranty, the implied TBW equals 3 × 2 TB × 365 × 5 ≈ 10 950 TB, whereas a consumer 1 TB drive with a 600 TBW rating translates to roughly 0.33 DWPD if used continuously for five years, highlighting how DWPD scales with capacity and usage intensity, while TBW remains a fixed cumulative figure that can be directly compared to actual write workloads such as 50 GB/day (≈0.025 DWPD for a 2 TB drive) or 200 GB/day (≈0.27 DWPD), illustrating that high‑intensity data‑center tasks often exceed consumer TBW limits long before the warranty expires, whereas typical desktop workloads stay well within both metrics.
When I map Workload tiers, I align low‑intensity tiers with modest Write patterns, medium tiers with 100‑200 GB/day, and high tiers with 500 GB+/day, each translating to distinct DWPD values; for example, a 4 TB drive at 500 GB/day yields ~0.31 DWPD, fitting enterprise tier expectations, while a 500 GB consumer drive at 30 GB/day remains under 0.02 DWPD, comfortably within its TBW envelope.
Thus, DWPD provides a daily‑rate perspective that directly reflects Write patterns across tiers, whereas TBW offers a lifetime aggregate useful for comparing actual usage against manufacturer specifications.
Recommended Products

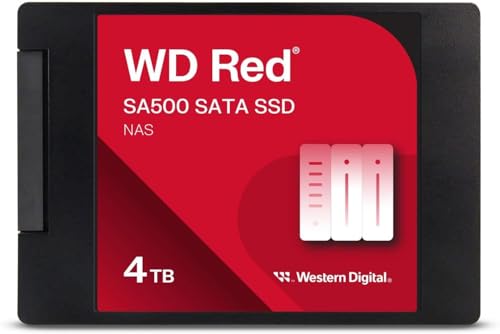
[High Endurance Grade] : No.1 NAS SSD choice in heavy workloads NAS systems|24/7 superior NAS Cache with reliable TBW|Data protection, Power loss protection, ECC, Easy integration, Silent operation|Sequential transfer speed up to 550 MB/s.

Enterprise grade storage

World's First 2TB SSD for Consumer PC
Pick an SSD That Meets Your Write‑Intensity Needs

The comparison of TBW and DWPD across workloads shows that total‑bytes‑written limits and daily‑full‑drive‑write rates govern endurance, so selecting an SSD now requires matching those metrics to the intended write intensity. I evaluate capacity tiers, noting that a 500 GB drive with 300 TBW suits moderate workloads, a 1 TB model offering 900 TBW accommodates higher daily writes, and a 2 TB unit with 1 800 TBW targets heavy‑duty applications. I also check thermal throttling specifications, ensuring that the controller’s heat‑dissipation design maintains sustained performance at 70 °C without speed reduction, because sustained writes increase temperature and can trigger throttling, which in turn reduces effective DWPD. I compare wear‑leveling algorithms, over‑provisioning ratios, and NAND type, confirming that TLC with aggressive error‑correction yields reliable endurance across the selected tier.
Recommended Products

Apple M1 Pro or M1 Max chip for a massive leap in CPU, GPU, and machine learning performance
ALIENWARE x17 R2: Push play to new limits with the innovative Alienware x17 R2, our thinnest 17" gaming laptop ever.
Get an gaming edge or boost your PCs ultimate Potential with this Gen4 SSD, delivers exceptional performance of up to 7,100MB/s seq. read and 6,700MB/s seq. write speeds. Top-tier 3D TLC NAND Flash combined with E18 controller and DRAM cache for maximum bandwidth and low latency.
Frequently Asked Questions
Will TBW Include Data Written During OS Installation?
Yes, it counts. Your initial setup and background writes—OS installation, hidden partitions, system logs—add to the TBW tally, quietly nudging the drive’s lifetime a little farther.
Does Wear‑Leveling Efficiency Affect the Advertised TBW?
I think wear‑leveling efficiency directly influences the advertised TBW; better wear‑leveling metrics let controller algorithms spread writes evenly, boosting endurance and raising the TBW impact you see on the spec sheet.
How Does Temperature Cycling Impact SSD Endurance Beyond TBW?
I’ll tell you that temperature cycling adds thermal stress, causing phase‑change and junction heating that accelerate cycling fatigue, so the drive ages faster than TBW alone predicts. This hidden wear can cut lifespan dramatically.
Are QLC Drives Ever Suitable for Heavy Video Editing Workloads?
I think QLC viability for heavy video editing is limited; its Burst performance helps with short spikes, but sustained writes wear cells fast, so I’d prefer a higher‑endurance TLC or NVMe drive.
Can Firmware Updates Extend the Usable TBW of an Existing SSD?
I’ll tell you: firmware updates can boost longevity, but they’re just a fresh coat of paint on a weather‑worn bridge. Controller optimizations may shave a few TBW years, yet the underlying cells still age.